Climate change and life on Earth, in 3D
The thin blue line
Shrink the Earth to a basketball and 99% of its air would sit within 0.6 mm of the surface.1, 2 Every forest, every reef and every person depends on that layer. This is how it keeps the Earth alive, how life breathes through it and how we are changing it, drawn on a globe of real data.
01The air
Everything happens inside this line
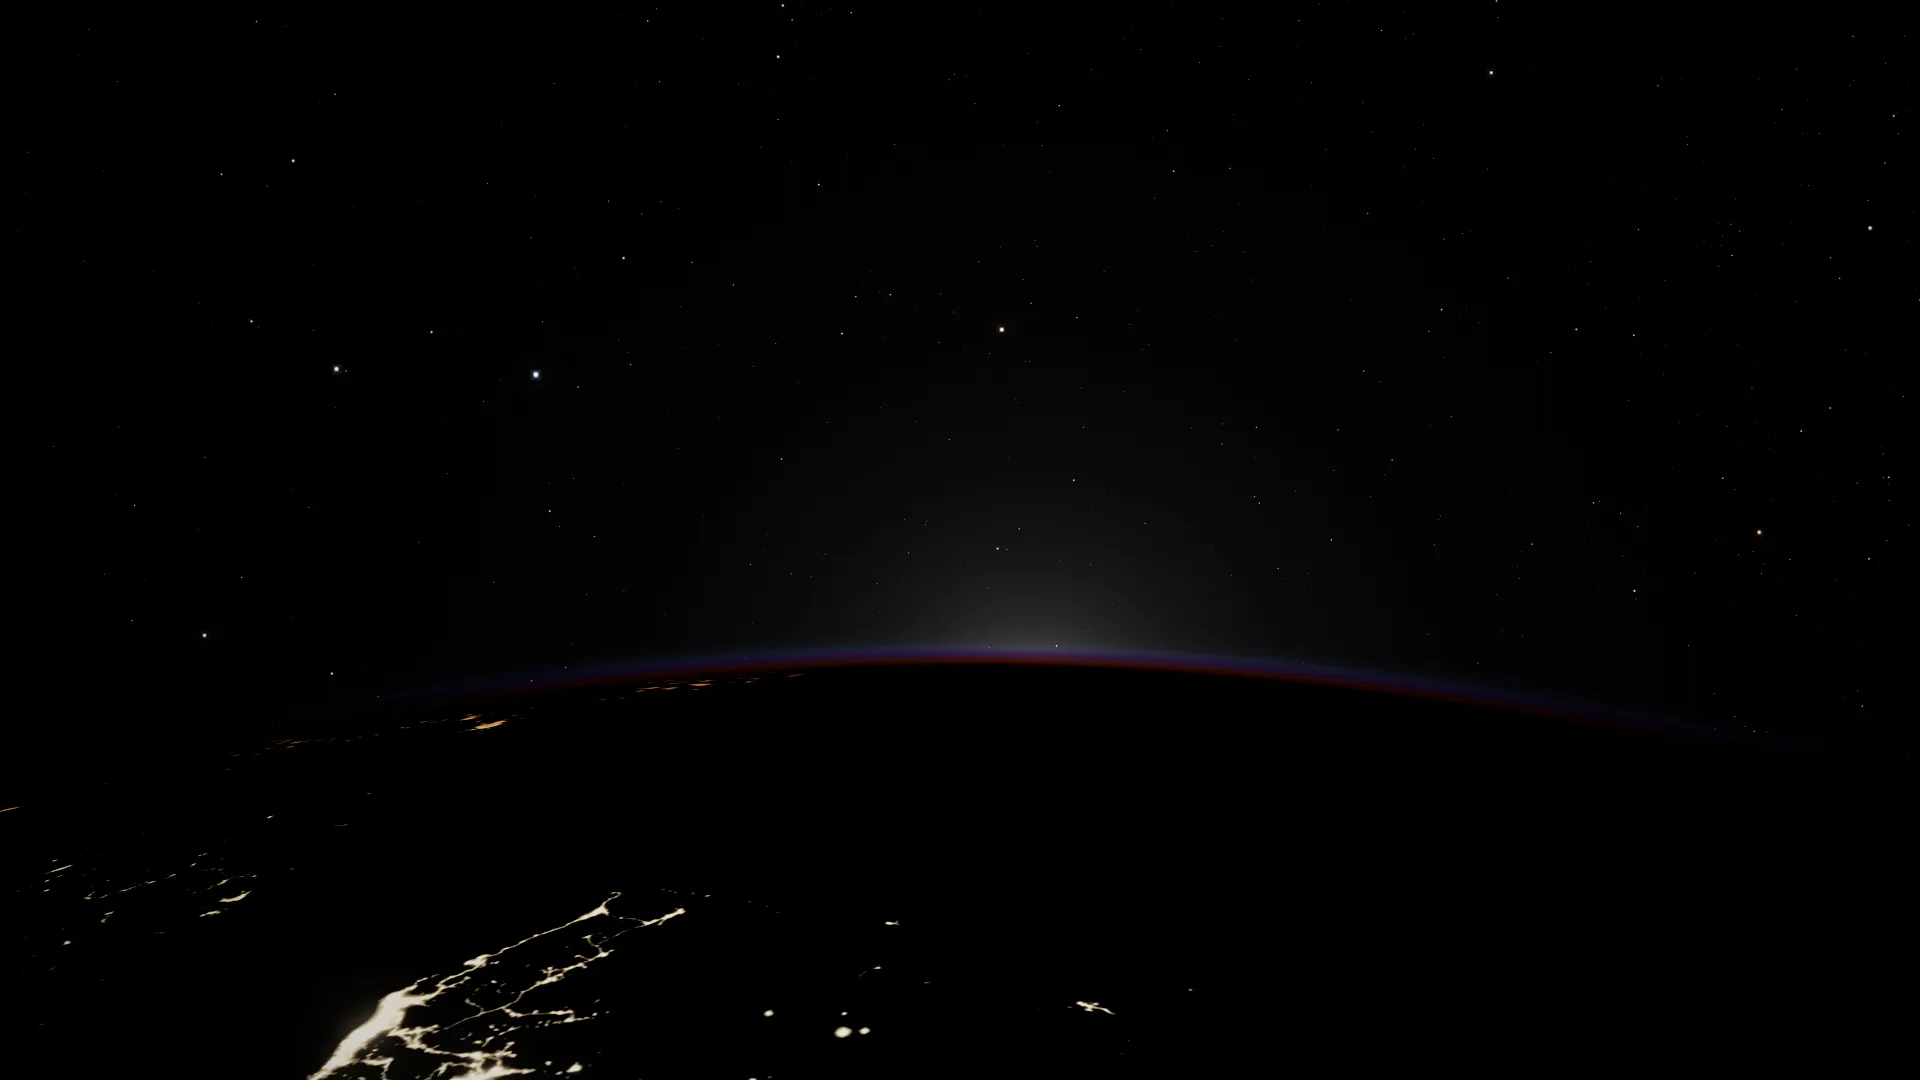
From orbit, all of the air is the glowing band along the horizon. Half of it lies below 5.5 km, and 99% within 31 km of the ground.1 The Earth is 6,371 km from surface to centre.3
Where this page began
The opening view is from the height of the International Space Station, about 420 km up.4 On the basketball that is 8 mm above the surface. Its crew see about 16 sunrises and 16 sunsets every day.5
Why it glows blue
Air molecules scatter blue light far more strongly than red, so the sky above us is blue and the band of air seen from orbit glows blue. Near the horizon sunlight crosses so much air that most of its blue is scattered away, and the Sun turns orange and red.6
How we know
Air pressure at any height is the weight of all the air above it. At 31 km the pressure is 1% of its value at sea level, so 99% of the air lies below that height.1
02Life
A planet that breathes
Every spring the north turns green, and the air feels it. Plants on land and plankton in the sea turn about 105 billion tonnes of carbon a year into new growth, 56 on land and 49 in the sea.7 Watch a year of satellite data: forests green and fade, deserts stay bare and the cold seas bloom.
Vegetation on land, plankton at sea
You can see it in the air
At Mauna Loa in Hawaii, carbon dioxide usually peaks in May and falls to its lowest in September or October as the northern forests grow, a swing of about 6 parts per million.9, 10 The north has most of the land, so it sets the beat.
The green mass of the world
Forests cover 4.14 billion hectares, 32% of the land.11 Plants hold about 450 of the 550 billion tonnes of carbon in all living things.12 The ocean's plankton make about as much oxygen as marine life uses up.8
How we know
Leaves absorb red light and reflect near-infrared strongly, so satellites measure both and take their normalised difference (NDVI) for vegetation.13 At sea, chlorophyll turns the water from blue toward green, which ocean-colour instruments read as the concentration of plankton.14
03Energy
Sunlight in, heat out
Spread over the whole turning globe, sunlight arrives at 340 watts on every square metre. About 100 of them bounce straight back from clouds, the air itself, ice and deserts, and the planet sheds 239 as invisible infrared heat.15 These maps are what NASA's CERES instruments measure leaving the Earth.16
Heat leaving the Earth (W/m²)
The blanket
Water vapour, carbon dioxide and methane let sunlight through but absorb part of the heat rising from the ground and send some of it back down. The ground receives 342 W/m² of infrared from the sky, more than twice the 160 W/m² of sunlight it absorbs.15
First measured
In 1856 Eunice Foote set glass cylinders of different gases in the sunshine and found the one holding carbon dioxide grew hottest. She wrote that an atmosphere of that gas would give the Earth a high temperature.18
Out of balance
The Earth now takes in about 1 W/m² more than it sheds, averaged over 2006 to 2025, more than twice the imbalance of 1976 to 1995.19 In 2023 satellites measured 1.8 W/m².20 Since 1971, ninety-one per cent of the extra heat has gone into the ocean.21
04Carbon dioxide
800,000 years in one line
Bubbles of ancient air sealed in Antarctic ice record carbon dioxide for 800,000 years. Through eight ice ages it never rose above 300 parts per million and never fell much below 175.22 Then, in a geological instant, it left that range behind.
The first reading
Charles David Keeling's first measurement at Mauna Loa, on 29 March 1958, was 313 ppm. In May 2026 the air there peaked at 432 ppm,25 55% above the 278 ppm of 1750.26
How we know it is ours
Four fingerprints. The carbon in the air is getting lighter, since fossil carbon is low in carbon-13. The new carbon holds no carbon-14, since fossil fuels are too old to keep any. Oxygen is falling as the fuel burns. And carbon dioxide is highest in the northern hemisphere, where most fuel is burned.24
Where it goes
Of every 10 tonnes of carbon dioxide released from 2015 to 2024, 5 stayed in the air, about 3 went into the ocean and about 2 into plants and soils.27
The last time
The last time the air held about this much carbon dioxide for long, about 3 million years ago, the world was 2.5 to 4 °C warmer than before industrialisation26 and the sea 5 to 25 m higher.21
Doubling carbon dioxide warms the Earth by about 3 °C once the oceans catch up, over centuries.21 Each further doubling adds about as much again, probably a little more.15 Choose a level.
Warming once the Earth settles at that level, against 1750, from the IPCC's best estimate of climate sensitivity (likely range), counting carbon dioxide alone21
05Temperature
A warming world
Scroll from 1880 to today through thermometers on land and at sea. Each colour is a place's yearly temperature against its own 1951 to 1980 average.28 The Arctic turns red first and furthest: since 1979 it has warmed nearly four times as fast as the planet as a whole.29
Temperature against 1951 to 1980
The whole globe in the chosen year, against 1951 to 198028
The record
2024 was the warmest year in NASA's record, 1.28 °C above the 1951 to 1980 average, and 2025 was effectively tied with 2023 for second.30, 31 The eleven years from 2015 to 2025 are the eleven warmest in all eight datasets the WMO uses.32
Past 1.5 °C
Measured against 1850 to 1900, 2024 was likely the first calendar year more than 1.5 °C warmer, at 1.55 ± 0.13 °C. The Paris goal is measured over decades, so a single warm year does not break it.33
The reefs
From January 2023 to September 2025, heat strong enough to bleach coral reached 84% of the world's reef area, the largest bleaching event on record.34, 35
How we know
NASA combines more than 25,000 weather stations on land with ship and buoy measurements of the sea surface.28, 31 The land has warmed faster than the sea: by 2011 to 2020, 1.59 °C against 0.88 °C since 1850 to 1900.21
06Ice
The shrinking cap
Each September the Arctic's floating sea ice shrinks to its smallest. From 1979 to 1990 it averaged about 7 million km² that month.36 In 2012 it fell to a record 3.39 million km² on its smallest day.37 Scroll through the Septembers.
Sea ice in the chosen September, the month's average extent36
The trend
Since 1979 the Arctic has lost September ice at about 74,000 km² a year, 11.6% a decade.38 The 20 smallest summer minimums have all come in the last 20 years.37
A mirror that melts
Bare sea ice reflects 50 to 70% of sunlight and snow-covered ice up to 90%. Open ocean reflects just 6% and soaks up the rest.39 Less ice means more sunlight absorbed, more warming and less ice again.
On land
Since 2002 Greenland has lost about 265 billion tonnes of ice a year and Antarctica about 135 billion.40 Melted completely, Greenland's ice would raise the sea about 7.4 m and Antarctica's about 58 m.41 The sea has already risen about 10 cm since 1993.42
07Us
Eight billion lights
The night side shows us. These are NASA's Black Marble lights, cloud-free nights in 2016 seen by the Suomi NPP satellite.43 About 8.3 billion people live on Earth in 2026.44
What we release
In 2025 burning fossil fuels and making cement released an estimated 38.1 billion tonnes of carbon dioxide, a record, plus about 4.1 billion tonnes from clearing forests and other changes to the land.45
What is changing
In 2025 renewables made 33.8% of the world's electricity and overtook coal, at 33.0%, for the first time in 100 years. Solar generation grew by a record 636 TWh, up 30% on 2024.46
The stars we lose
Our lights now hide the Milky Way from more than a third of humanity.47
08Repair
We are fixing the sky
In 1985 scientists reported deep losses of ozone over Antarctica each spring.48 Two years later the world agreed the Montreal Protocol to phase out the chemicals destroying it, and in 2009 it and its parent treaty, the Vienna Convention, became the first treaties in UN history ratified by every country.49
Ozone overhead (Dobson units)
The hole
The ozone hole's largest single day was 9 September 2000, at 29.9 million km².52 In 2025 it averaged 18.7 million km², the fifth smallest since 1992, and broke up nearly three weeks early.53
The world avoided
Without the treaty, two-thirds of the ozone layer would have been destroyed by 2065.54 The extra ultraviolet light could have stunted plants so badly that the lost carbon sink alone could have added 0.5 to 1.0 °C of warming by the end of this century.55
09One atmosphere
One sky, shared
Every country breathes the same air. Carbon dioxide released anywhere spreads through the whole atmosphere, so what one place adds, every place keeps. That is what makes climate change hard. It is also why the ozone story matters: the whole world measured a problem in the sky, agreed on it and is fixing it.
Keep exploring
Every map on this page is drawn from measurements: satellites, weather stations, ice cores, ocean floats and the air sampled at Mauna Loa. The sources are listed below, and the live 3D viewer shows the same Earth at the real time of day.
Questions
What is climate change?
A long-term shift in the Earth's weather and temperatures. Today's warming comes mainly from the greenhouse gases released by burning coal, oil and gas, which hold more heat in the atmosphere. The IPCC calls human influence on the warming unequivocal.21
How do we know humans are causing it?
The extra carbon dioxide carries the fingerprints of fossil fuels: it is low in carbon-13, holds no carbon-14, comes with falling oxygen and is highest where most fuel is burned.24 The IPCC finds it unequivocal that human influence has warmed the air, ocean and land.21
What is the greenhouse effect?
Gases such as water vapour, carbon dioxide and methane absorb part of the infrared heat the ground gives off and send some back down. Without them the Earth would average about −18 °C. With them it averages about 15 °C.17
How much carbon dioxide is in the air now?
About 427 parts per million at Mauna Loa as a 2025 average,23 up from 278 in 1750.26
Is the ozone hole the same problem as climate change?
They are two problems with a link. The ozone hole comes from chlorine and bromine chemicals destroying ozone high in the stratosphere, and climate change from greenhouse gases trapping heat. Banning the ozone-destroying chemicals also protected the plants that store carbon.55
Sources
- NOAA, NASA and USAF (1976), U.S. Standard Atmosphere, 1976 (pressure by height)
- FIBA Official Basketball Rules 2026: Basketball Equipment (ball size 7, 750 to 770 mm round)
- NASA NSSDCA: Earth fact sheet
- CelesTrak: orbital elements for the International Space Station (NORAD 25544)
- NASA: Space Station Facts and Figures
- NASA Space Place: Why is the sky blue?
- Field, C. B., Behrenfeld, M. J., Randerson, J. T. and Falkowski, P. (1998), Primary Production of the Biosphere: Integrating Terrestrial and Oceanic Components, Science 281, 237
- NOAA National Ocean Service: How much oxygen comes from the ocean?
- NOAA Global Monitoring Laboratory: Mauna Loa CO2 monthly means
- Scripps Institution of Oceanography: Why does atmospheric CO2 peak in May?
- FAO (2025), Global Forest Resources Assessment 2025: global deforestation slows, but forests remain under pressure
- Bar-On, Y. M., Phillips, R. and Milo, R. (2018), The biomass distribution on Earth, PNAS 115, 6506
- NASA Earth Observatory: Measuring Vegetation (NDVI and EVI)
- NASA Earth Observatory: What are Phytoplankton?
- Forster, P. et al. (2021), The Earth's Energy Budget, Climate Feedbacks and Climate Sensitivity, IPCC AR6 WG1 chapter 7 (Figure 7.2)
- Loeb, N. G. et al. (2018), Clouds and the Earth's Radiant Energy System (CERES) Energy Balanced and Filled (EBAF) Top-of-Atmosphere Edition-4.0 Data Product, Journal of Climate 31, 895
- NASA Earth Observatory: Global Warming
- APS News (2023), Eunice Foote and the first measurement of carbon dioxide's warming (Foote 1856, American Journal of Science and Arts 22, 382)
- Forster, P. M. et al. (2026), Indicators of Global Climate Change 2025, Earth System Science Data 18, 3889
- Mauritsen, T. et al. (2025), Earth's Energy Imbalance More Than Doubled in Recent Decades, AGU Advances 6, e2024AV001636
- IPCC (2021), Climate Change 2021: The Physical Science Basis, Summary for Policymakers
- Bereiter, B. et al. (2015), Revision of the EPICA Dome C CO2 record from 800 to 600 kyr before present, Geophysical Research Letters 42, 542 (data: NOAA NCEI composite)
- NOAA Global Monitoring Laboratory: Mauna Loa CO2 annual means
- Canadell, J. G. et al. (2021), Global Carbon and other Biogeochemical Cycles and Feedbacks, IPCC AR6 WG1 chapter 5
- UC San Diego, Scripps Institution of Oceanography (2026): Annual carbon dioxide peak reaches 432 parts per million
- Gulev, S. K. et al. (2021), Changing State of the Climate System, IPCC AR6 WG1 chapter 2
- Friedlingstein, P. et al. (2026), Global Carbon Budget 2025, Earth System Science Data 18, 3211
- NASA GISS Surface Temperature Analysis (GISTEMP v4)
- Rantanen, M. et al. (2022), The Arctic has warmed nearly four times faster than the globe since 1979, Communications Earth and Environment 3, 168
- NASA (2025): Temperatures Rising, NASA Confirms 2024 Warmest Year on Record
- NASA (2026): NASA Releases Global Temperature Data
- WMO (2026): WMO confirms 2025 was one of warmest years on record
- WMO (2025): WMO confirms 2024 as warmest year on record at about 1.55 °C above pre-industrial level
- NOAA NESDIS (2026): World's Fourth Mass Coral Bleaching Event Likely Ended in 2025
- NOAA Coral Reef Watch: Fourth global coral bleaching event, status (updated 2 June 2026)
- Fetterer, F. et al., Sea Ice Index (G02135), NSIDC
- NSIDC Sea Ice Today (23 September 2026): Arctic sea ice minimum ties for tenth lowest
- NSIDC Sea Ice Today (7 October 2026): Stranger Things in the 2026 Arctic
- NSIDC: Science of Sea Ice
- NASA Earth Indicators: Ice Sheets (GRACE and GRACE-FO)
- NSIDC: Ice Sheet Quick Facts
- NASA JPL (2026): NASA Analysis Shows La Niña Limited Sea Level Rise in 2025
- NASA Scientific Visualization Studio: Black Marble 2016
- United Nations DESA, World Population Prospects 2024
- Global Carbon Project (2025): Fossil fuel CO2 emissions hit record high in 2025
- Ember (2026), Global Electricity Review 2026
- Falchi, F. et al. (2016), The new world atlas of artificial night sky brightness, Science Advances 2, e1600377
- Farman, J. C., Gardiner, B. G. and Shanklin, J. D. (1985), Large losses of total ozone in Antarctica reveal seasonal ClOx/NOx interaction, Nature 315, 207
- UNEP Ozone Secretariat (2012), Handbook for the Montreal Protocol on Substances that Deplete the Ozone Layer, 9th edition
- WMO (2023): Ozone layer recovery is on track, helping avoid global warming by 0.5 °C
- NASA Ozone Watch: What is a Dobson Unit?
- NASA Ozone Watch: Antarctic ozone hole, annual records
- NASA (2025): NASA, NOAA Rank 2025 Ozone Hole as 5th-Smallest Since 1992
- Newman, P. A. et al. (2009), What would have happened to the ozone layer if chlorofluorocarbons (CFCs) had not been regulated?, Atmospheric Chemistry and Physics 9, 2113
- Young, P. J. et al. (2021), The Montreal Protocol protects the terrestrial carbon sink, Nature 596, 384
The globe's maps are real data drawn on the viewer's Earth: vegetation and ocean chlorophyll from NASA satellites, the Earth's energy from CERES, temperatures from NASA GISTEMP, sea ice from NSIDC and ozone from satellite records. Colours are chosen to be read, and every legend gives the scale.