How it was made
Nearly everything in the viewer is worked out from real numbers, real maps and real measurements, and where something is made up, the page that shows it says so. This is how each layer was built, where its data comes from and how it was checked, with every picture here rendered from the viewer itself1.
It all runs on a clock
Every body in the viewer is placed from the date. Pick a moment and it works out where each planet is from VSOP87, the planetary theory Pierre Bretagnon and Gérard Francou published in 19882, and from 1800 to 2200 the planets land within 100,000 km of JPL Horizons3, 4.
JPL's simpler fitted orbits, which stand in while the series loads, can be more than 8 million km out over the same years5.
The orrery behind these words runs that same series. Drag the date and the planets go where they really were, or will be, on that day. The distances are to scale and the dots aren't, since at this scale even Jupiter would be smaller than a pixel.
Pull out to Neptune and press Play, and each second is about two and a half years: the outer planets crawl while the inner ones blur round the Sun.
The Moon has a theory of its own, chapter 47 of Jean Meeus's Astronomical Algorithms6. Meeus gives its place in the frame of its own date, which turns about 0.4 degrees away from the planets' frame by 2027, enough to make the 2026 eclipse miss the Earth, so the viewer carries it across7.
The named moons fly orbits fitted to Horizons, fourteen numbers each, and every planet stands on its pole and turns on its prime meridian as the IAU's report gives them8, so Saturn's rings open and close as we see them from here3.


The Earth, one layer at a time
Start with a ball and a photograph. The day map is NASA's Blue Marble Next Generation for June 2004, made by Reto Stöckli from the MODIS cameras9, and the land's height comes from NOAA's ETOPO 202210. On a plain lit ball, with nothing else on, this is all it is.
Each picture in this chapter is the same held frame of the viewer, 20 October 2026 at 17:00 UTC, with the layers above it switched off.
Then the sea gets a shader of its own. Its colour follows how deep the water is and how clear, from ETOPO's depths and MODIS-Aqua's measure of how fast light fades in the water, and the light fading down through it follows Morel and Maritorena's measurements11, 12.
The bright patch is the Sun's glint, spread over wind-ruffled waves the way Cox and Munk measured it from photographs of the Sun's glitter on the sea13.
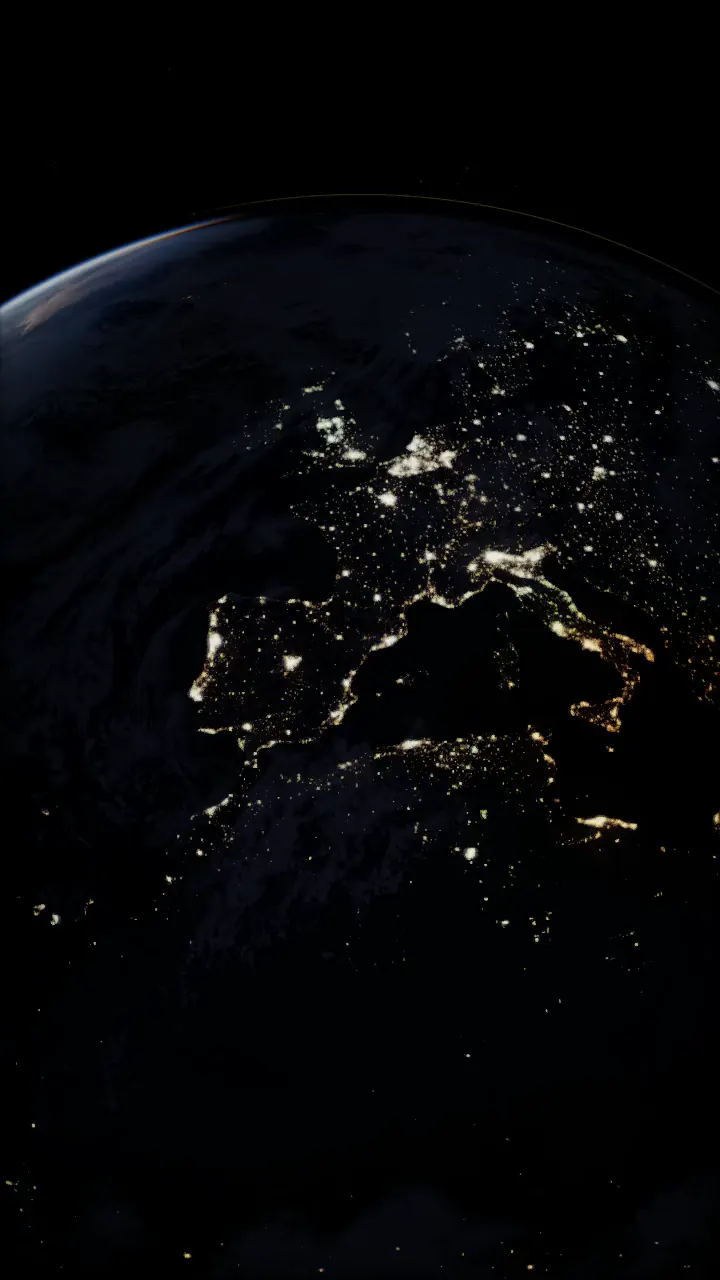
Last, the night. Past the terminator the cities come on from NASA's Black Marble, the Earth's lights in 2016 as the VIIRS camera on Suomi NPP saw them17.
Then it was checked against the real thing. NASA's EPIC camera photographs the whole sunlit Earth from deep space18, and on six of its frames from 2024 to 2026 the viewer's clear ocean came out at 0.94 of EPIC's brightness, the Sahara at 1.05 and the Amazon at 0.95.
The colours were fitted to EPIC to begin with, so this shows how well the fit holds, and the accuracy page says as much19.


The coarse levels ship with the site and the finer ones stream straight from NASA as you close in, so the delta sharpens as you drop through it21.
160 km above the Nile delta.


Come close and it has a surface. Its granules are cells about 1,200 km across that are born, swell and die on a clock running ten times fast, and the whole disc darkens towards its edge by the law Neckel and Labs measured23, 25.
The sunspots follow the date, their number and latitude from the solar cycle, each group tilted by Joy's law26.
This is the Detailed style, in colour. The viewer opens on the Realistic style, which keeps the Sun white.
On the limb, prominences are volumes of glowing hydrogen, ray marched as curtains, loops and twisted arches, and one of the arches erupts every five minutes23.
The Realistic style, 1.9 solar radii from the Sun's centre.


The sky behind it all
The stars you can pick out are real ones, from the HYG catalogue down to magnitude 8 and Tycho-2 from there to 1027, 28, and behind them is the glow of the faint ones from NASA's Deep Star Maps, made from ESA's Gaia29. They're all drawn at one exposure, with no diffraction spikes, and every one is placed through the same sky frame30.
Towards the centre of the galaxy, 20 June 2026.
The asteroid belt is 164,776 real asteroids from JPL's orbital elements, each solved on its own orbit for the date on the graphics card, so the Kirkwood gaps, the Hildas' triangle and Jupiter's Trojans are the data's own31, 30.
They shine at their true brightness by default, which is faint, and this picture turns on the switch that lights them by size.
From your street to the edge
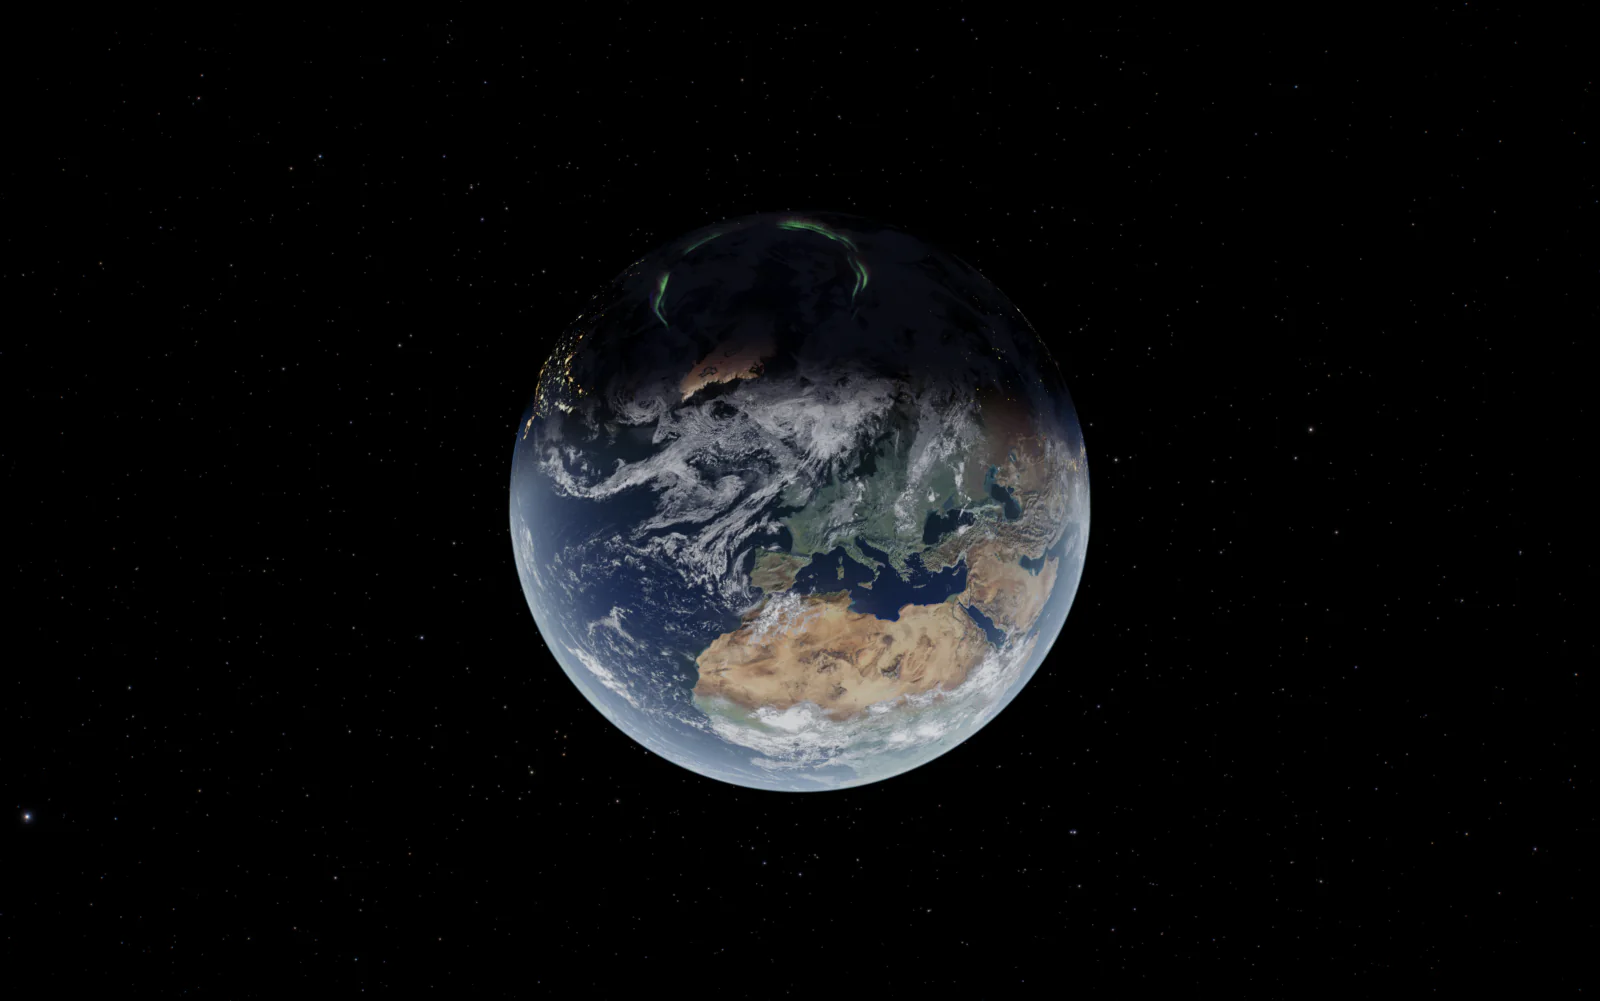
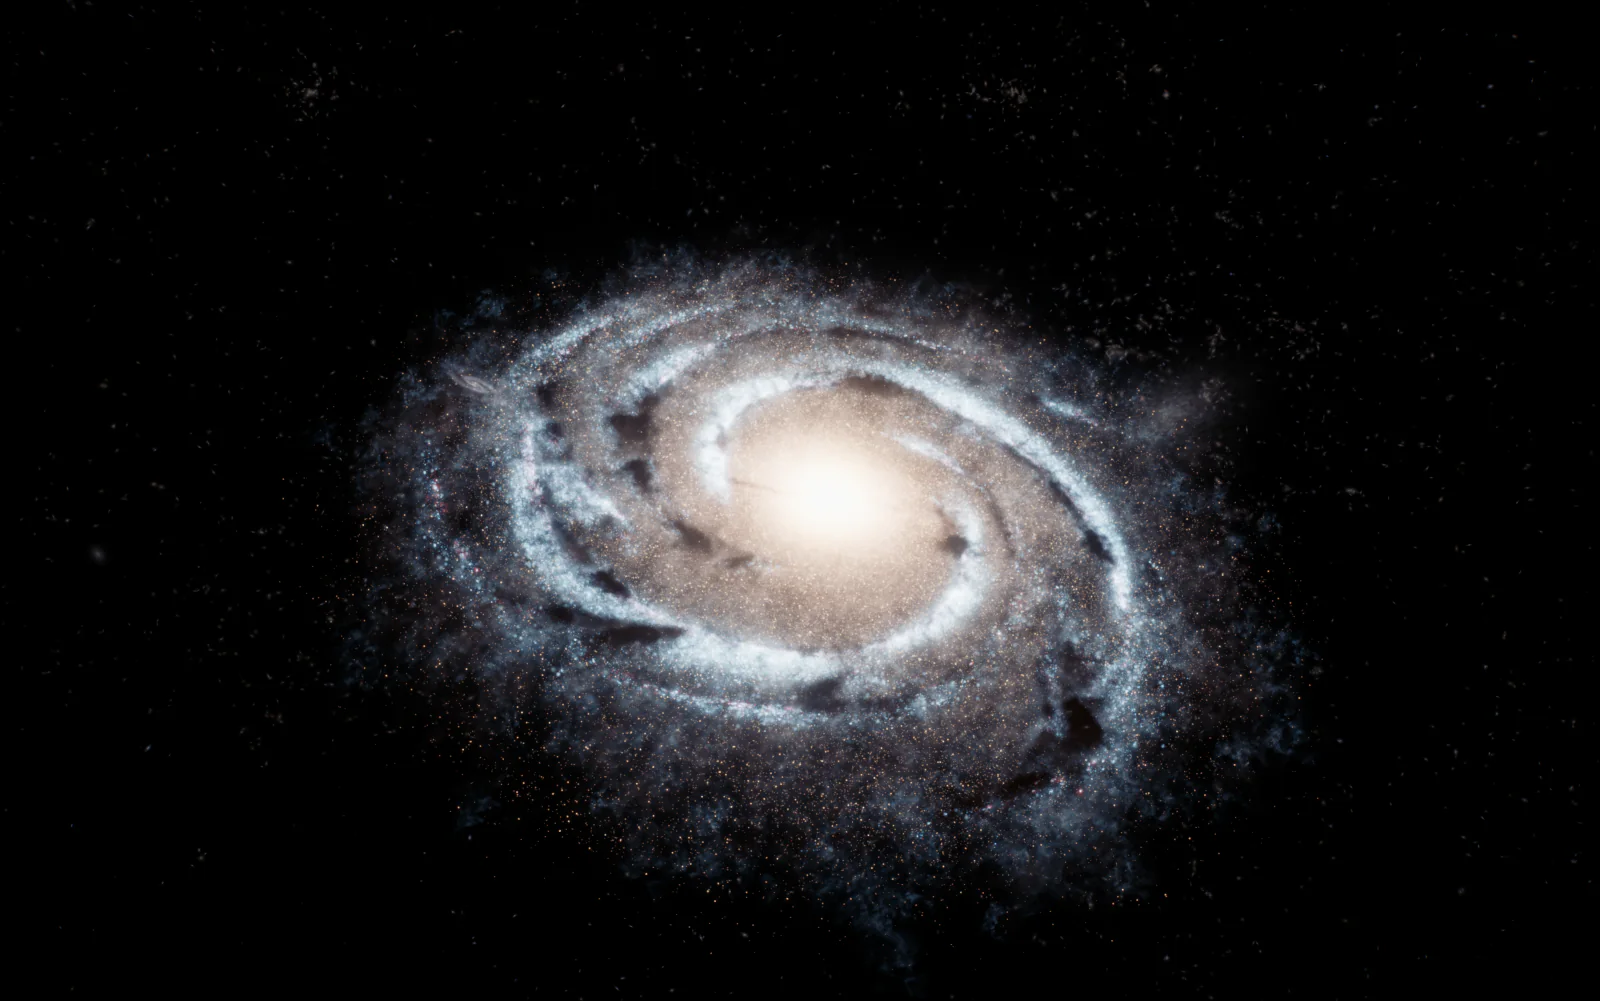
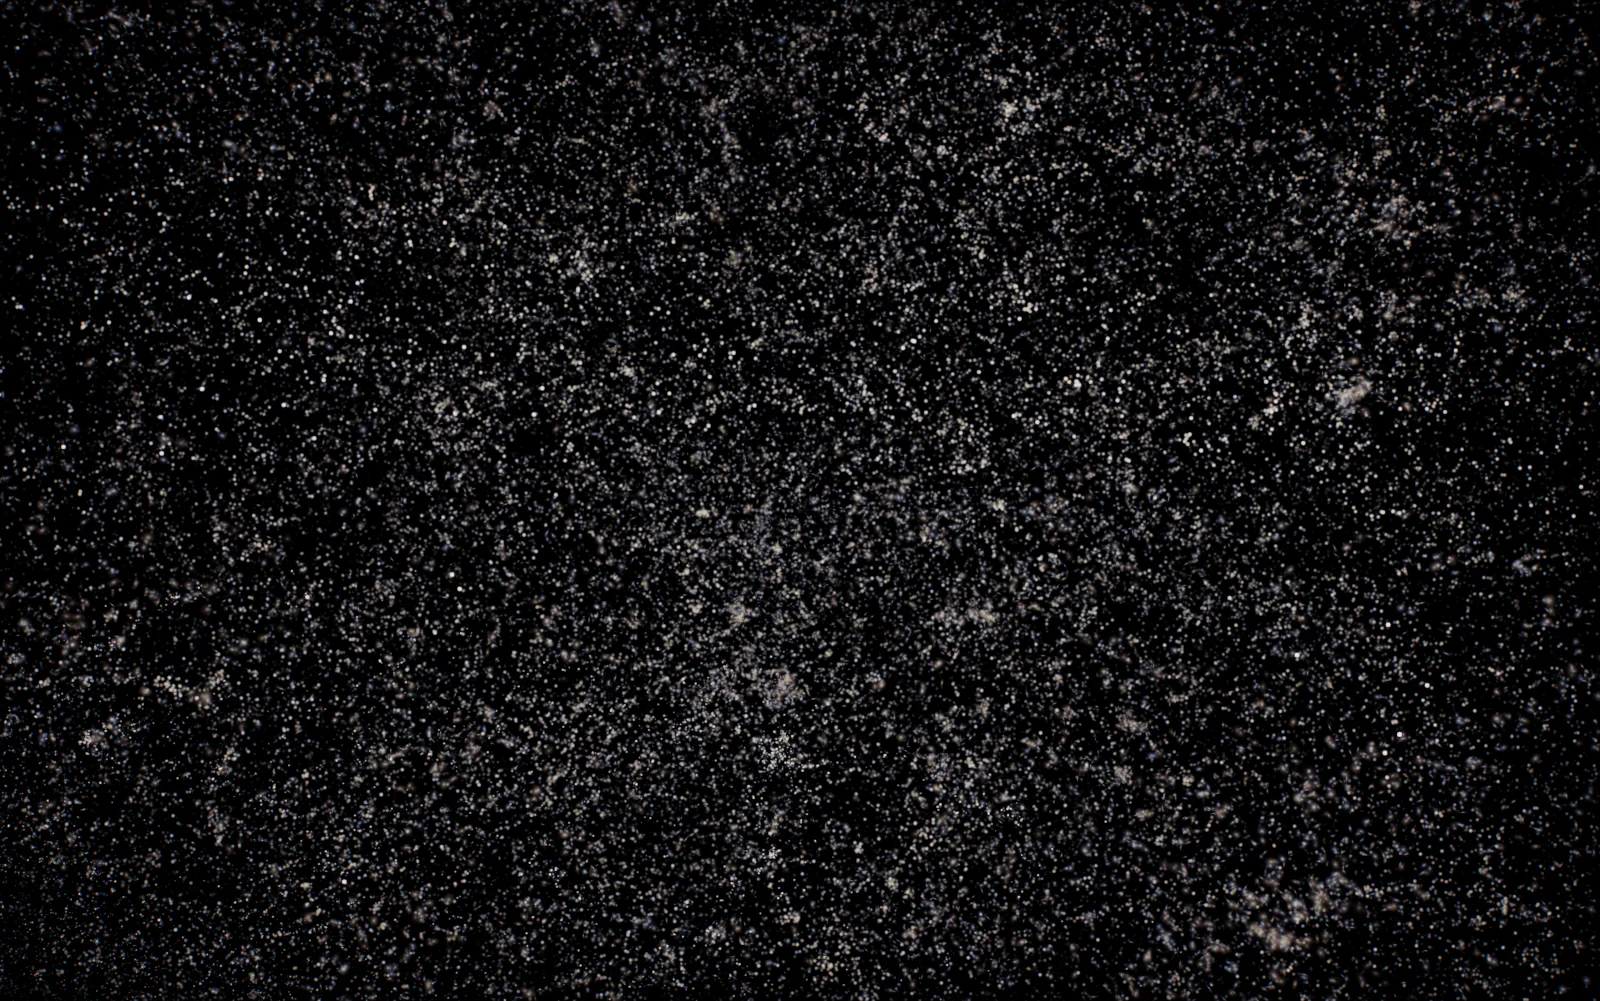
The zoom out is one unbroken pull back from 8 km above home to the microwave background, about two minutes at a nearly even pace32, 33.
The planets are moved onto the camera's line so you pass them, and the flight says so while it does.
Pictures from the flight, rendered for the universe page.


Black holes, traced ray by ray
On the black holes page every pixel's light is followed backwards through the curved spacetime round the hole, stepped with RK4 in units of its own radius38, 39. The disk is a thin Shakura-Sunyaev disk40, each patch drawn as a blackbody at its temperature and shifted by its speed and by gravity, which is why one side burns brighter.
Near the shadow's edge each pixel traces five rays, so the thin ring of light that has looped round the hole stays a ring. Blurred to the Event Horizon Telescope's resolution, the model's ring comes out within 3% of the size of the one in the 2019 picture of M87*38, 41.
The sky behind is NASA's Deep Star Maps again.


Flight is integrated with RK4, a coasting craft goes on rails along its Kepler orbit while the map predicts its path in patched conics, and each engine's plume is a volume ray marched by its propellant, with Mach diamonds43.
And the sound
The music is written as you listen. Tone.js plays jazz chord voicings on soft sine pads over a sub bass and a drone on the chord's root, with two rising arpeggios and a little brown noise46, 47.
If you'd rather have a recorded piece, Quiet Wonder is 8 minutes 14 seconds on a seamless loop, and it's what the App Store apps start with47.
Counted when this page was built
The first commit went in on 25 November 2025, and by 8 November 2026, the last time the history was counted, there had been 960 commits since48.
The viewer itself is one file of 37,642 lines, and the source runs to 253,714 lines across 718 JavaScript files, with 213 places that build a custom shader material48.
105 test suites and 39 more test scripts check it, and the checks against JPL, the US Naval Observatory and NASA are listed with their results on the accuracy page19.
Who makes it
Our Solar System is made by Polyxmedia, which also puts out its videos as Voidmode Studios, and every map, dataset and library it stands on is credited on the credits page49, 1.
Sources
- Our Solar System: credits, every data source, map and library
- Bretagnon, P. and Francou, G. (1988), Planetary theories in rectangular and spherical variables: VSOP 87 solutions, Astronomy and Astrophysics 202, 309
- The viewer's true scale and its tests against Horizons: the planets, the moons and the poles (src/orbits/trueplaces.js, moonplaces.js and bodyframe.js; tests/true-scale-planets.test.js, true-scale-moons.test.js and true-scale-poles.test.js)
- JPL Horizons, the ephemeris service of JPL's Solar System Dynamics group
- JPL: approximate positions of the planets, the Keplerian elements fitted for 1800 to 2050
- Meeus, J. (1998), Astronomical Algorithms, 2nd edition, Willmann-Bell, chapter 47: the position of the Moon
- The viewer's Moon (src/orbits/moon.js, carried into the planets' frame by moonGeocentricJ2000 in src/eclipse/geometry.js)
- Archinal, B. A. et al. (2018), Report of the IAU Working Group on Cartographic Coordinates and Rotational Elements: 2015, Celestial Mechanics and Dynamical Astronomy 130, 22
- NASA Earth Observatory: Blue Marble Next Generation, the June 2004 map (Reto Stöckli, NASA Goddard Space Flight Center)
- NOAA NCEI: ETOPO 2022 Global Relief Model
- The viewer's sea (src/shaders/earthocean.js, public/textures/earth_ocean.webp and its build notes)
- Morel, A. and Maritorena, S. (2001), Bio-optical properties of oceanic waters: A reappraisal, Journal of Geophysical Research 106, 7163
- Cox, C. and Munk, W. (1954), Measurement of the Roughness of the Sea Surface from Photographs of the Sun's Glitter, Journal of the Optical Society of America 44, 838
- NASA Visible Earth: The Blue Marble, true colour global imagery at 1 km, its cloud layer (MODIS Terra, 2001)
- O'Neil, S. (2005), Accurate Atmospheric Scattering, GPU Gems 2, chapter 16, NVIDIA
- The viewer's Earth (src/shaders/earth.js, src/shaders/atmosphere.js)
- NASA Earth Observatory: Earth at Night, the Black Marble 2016 maps (Suomi NPP VIIRS)
- NASA DSCOVR EPIC, the Earth Polychromatic Imaging Camera
- Our Solar System: How accurate is it? Every check against JPL, the USNO and NASA
- NASA GIBS, the Global Imagery Browse Services: the Landsat WELD corrected reflectance annual global layer
- The viewer's imagery stream (src/data/earthImagerySource.js, src/rocketry/planetimagery.js): Landsat to level 11, then Sentinel-2
- EOX IT Services: Sentinel-2 cloudless 2016 (contains modified Copernicus Sentinel data 2016), CC BY 4.0
- The viewer's Sun (src/shaders/sun.js, src/shaders/sunglare.js and the glare block of the cinematic pass in src/main.js)
- Ritschel, T., Ihrke, M., Frisvad, J. R., Coppens, J., Myszkowski, K. and Seidel, H.-P. (2009), Temporal Glare: Real-Time Dynamic Simulation of the Scattering in the Human Eye, Computer Graphics Forum 28, 183
- Neckel, H. and Labs, D. (1994), Solar limb darkening 1986-1990 (λλ 303 to 1099 nm), Solar Physics 153, 91
- Hale, G. E., Ellerman, F., Nicholson, S. B. and Joy, A. H. (1919), The Magnetic Polarity of Sun-Spots, Astrophysical Journal 49, 153
- The HYG Database by Astronexus (Hipparcos, Yale and Gliese)
- Høg, E. et al. (2000), The Tycho-2 catalogue of the 2.5 million brightest stars, Astronomy and Astrophysics 355, L27
- NASA Scientific Visualization Studio: Deep Star Maps 2020 (from Gaia DR2)
- The viewer's sky frame and asteroids (src/sky/frame.js, src/sky/asteroids.js, public/data/asteroids.bin.gz counted at build time)
- JPL Solar System Dynamics: orbital elements of the numbered asteroids
- The zoom out (src/zoomout/ and its notes): the pace, the staged planets and the three galaxy layers
- Our Solar System: the zoom out as a page, its twelve stops to scale
- Makarov, D., Prugniel, P., Terekhova, N., Courtois, H. and Vauglin, I. (2014), HyperLEDA. III. The catalogue of extragalactic distances, Astronomy and Astrophysics 570, A13
- Tempel, E., Tuvikene, T., Kipper, R. and Libeskind, N. I. (2017), Merging groups and clusters of galaxies from the SDSS data, Astronomy and Astrophysics 602, A100
- Feng, Y., Chu, M.-Y., Seljak, U. and McDonald, P. (2016), FastPM: a new scheme for fast simulations of dark matter and haloes, Monthly Notices of the Royal Astronomical Society 463, 2273
- Planck Collaboration (2020), Planck 2018 results. VI. Cosmological parameters, Astronomy and Astrophysics 641, A6
- The black hole ray tracer (src/site/blackholes/raytrace.js, geodesic.js and scenes.js)
- Our Solar System: Black holes, ten scenes ray traced in the browser
- Shakura, N. I. and Sunyaev, R. A. (1973), Black holes in binary systems. Observational appearance, Astronomy and Astrophysics 24, 337
- Event Horizon Telescope Collaboration (2019), First M87 Event Horizon Telescope Results. I. The Shadow of the Supermassive Black Hole, Astrophysical Journal Letters 875, L1
- NASA Earth fact sheet (volumetric mean radius 6,371.0 km)
- The rocketry game (src/rocketry/ and docs/rocketry-dev.md): the scene, the physics, the plumes, the docking autopilot and the rover
- Our Solar System: Qmax, the rocketry game
- NASA Planetary Data System: LRO Lunar Orbiter Laser Altimeter, LDEM_64
- Tone.js, a Web Audio framework for making music in the browser
- The viewer's music (src/audio/spaceAmbient.js, src/audio/recorded.js)
- The site's repository, counted when this page was built (scripts/site/how-it-was-made-stats.js)
- Our Solar System: about, who makes it
Sources without a link are files in the site's own code, which isn't public.